
Business KPI Dashboard Spreadsheet for Performance and Growth Tracking
Track key business performance indicators and monitor company performance using a centralized data-driven dashboard.
$39.00$29.00
The Business KPI Dashboard Spreadsheet is designed to help entrepreneurs and business managers track the key performance indicators that determine business success.
Businesses generate large amounts of data every month, but without proper organization it can be difficult to evaluate performance and identify opportunities for improvement. This spreadsheet provides a centralized dashboard where businesses can monitor the metrics that matter most.
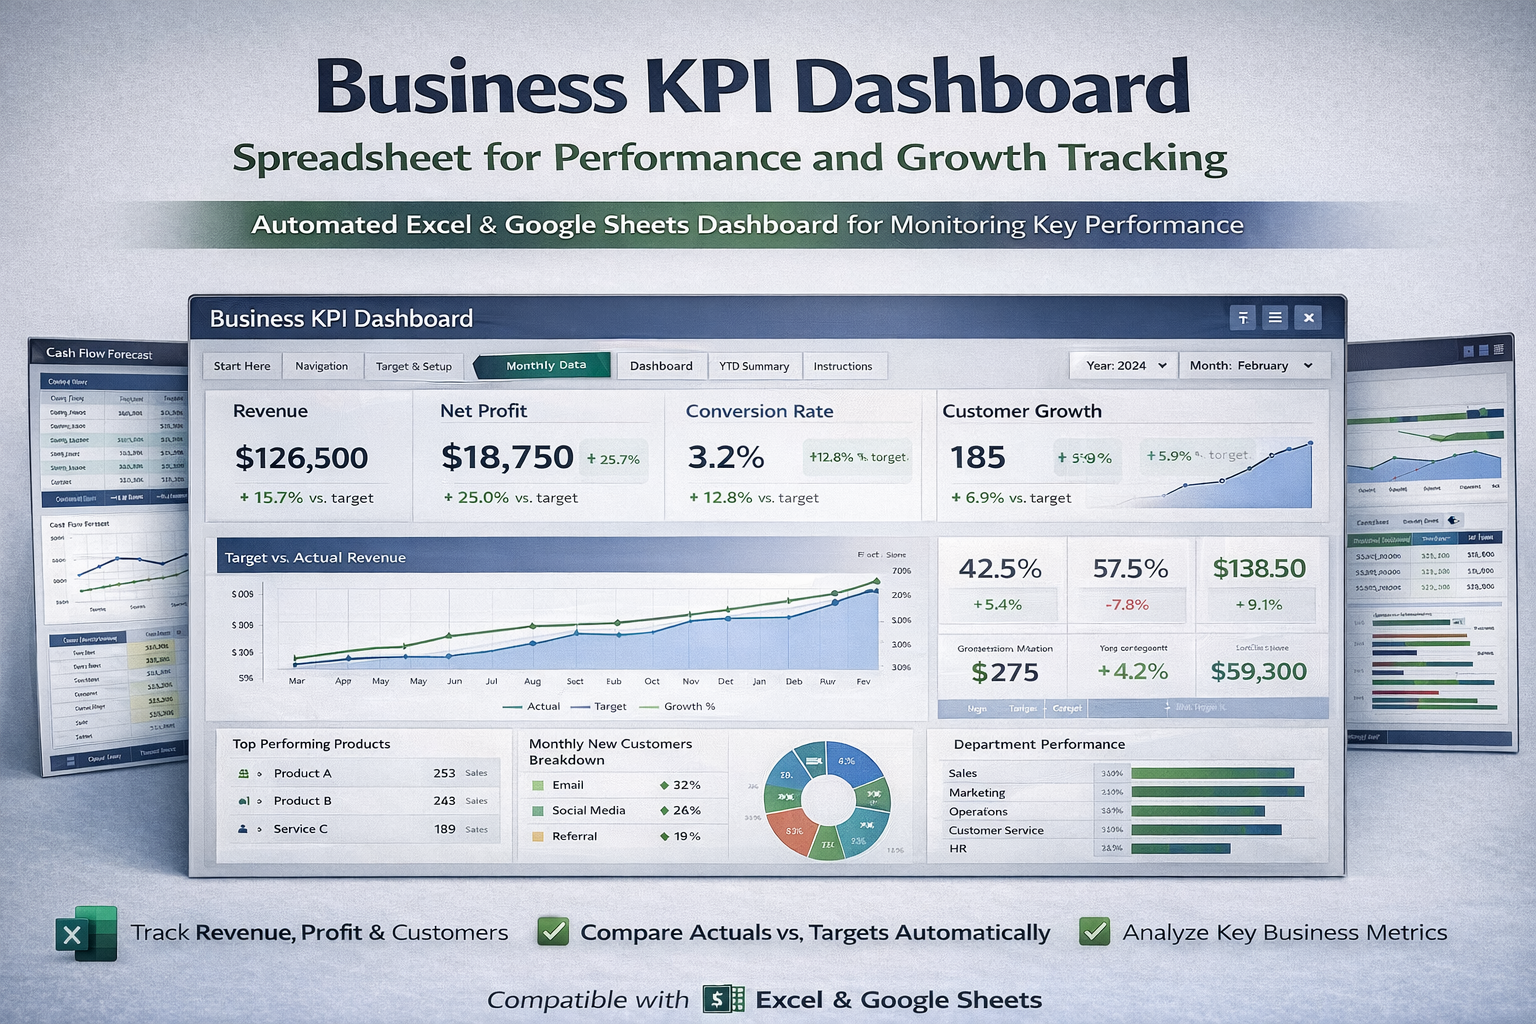
Users can track important indicators such as revenue growth, profit margins, customer acquisition, operational efficiency, and sales performance. By organizing these metrics into one dashboard, business owners can quickly assess whether their company is meeting its goals.
The spreadsheet automatically calculates KPI performance and compares actual results with predefined targets. This allows businesses to measure progress and detect performance gaps early.
The dashboard includes visual charts and summaries that provide a clear overview of company performance, helping decision-makers identify trends and prioritize strategic actions.
A complete training guide is included to help users configure KPIs, enter performance data, interpret dashboard metrics, and remove the demo content included in the spreadsheet.
Who This Spreadsheet Is For
Entrepreneurs
Startup founders
Business managers
Consultants
Business analysts