
Stock Portfolio Tracker Spreadsheet for Excel and Google Sheets
Track your investments, monitor portfolio performance, and organize stock transactions in one beginner-friendly spreadsheet system.
$27.00$24.00
The Stock Portfolio Tracker Spreadsheet is a professional investment tracking tool designed to help investors organize, monitor, and analyze their stock portfolio in a clear and structured way.
Managing investments can quickly become difficult when transactions, dividends, performance, and portfolio value are scattered across multiple apps or documents. This spreadsheet solves that problem by giving users a centralized system for tracking their stock holdings, purchase history, portfolio allocation, and gains or losses.
The spreadsheet is designed for both beginner and intermediate investors who want a clean and simple way to understand how their investments are performing without relying on expensive portfolio software.
Inside the workbook, users can record each stock purchase, track the number of shares they own, monitor cost basis, and compare portfolio value against their original investment. The spreadsheet also includes a dedicated dividend tracker so users can organize passive income and better understand the full return of their portfolio.
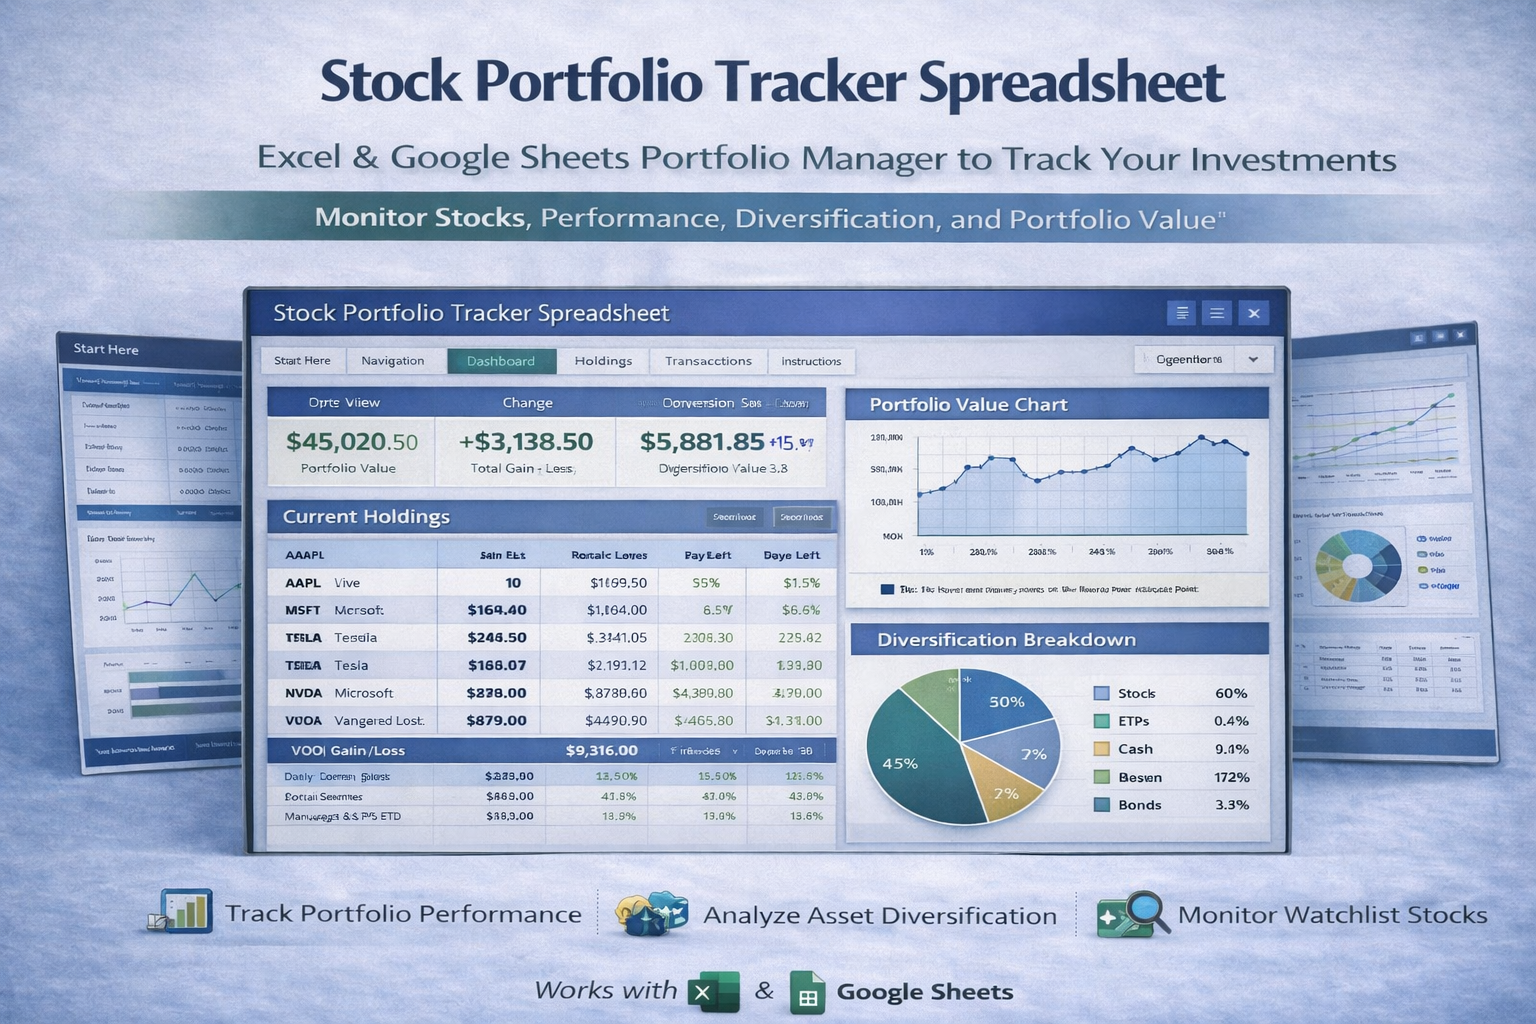
The dashboard provides a visual summary of portfolio performance, helping users quickly see total value, gains, losses, and asset allocation. This makes it easier to understand concentration risk, identify strong performers, and make more informed investment decisions.
A detailed beginner-friendly training guide is included inside the spreadsheet. The guide explains how to enter transactions, how to update portfolio data, how to add more rows safely, and how to replace sample data with personal investment data without damaging formulas.
This spreadsheet is ideal for investors who want a professional but easy-to-use portfolio management tool.